Application of Video Technology in Football Refereeing – VAR

A referee in a match of football has full authority to enforce the Laws of the Game, consequently being exposed to controversies when it comes to interpreting a given situation. This risk is evidenced when considering that the referee’s observation can be influenced by various factors:

  • Position on the field (i.e. being prone to a parallax errors; the deceptive change in the relative position of an object with a change in the position of the observer)

  • The frequent high ball speeds, particularly during shots on goal, that can reach up to 120km/h, thus make it is challenging for the human vision and other cognitive systems to estimate its position.

Supporting technologies to aid referees’ decision-making and reduce incorrect decisions have been emerging in recent years. Some of these include the use of microchip balls and signals to referee, microphones and earpieces, electronic sensors in goal posts, tracking systems for off-side play, goal-line technology and, most recently, video assistant referee. These type of technological officiating aids aim to enhance the overall quality of the refereeing in the game of football. By having an improved decision making by referees, the integrity of the game is protected and more qualitative content for football fans is produced. Nevertheless, arguments have emerged suggesting that the introduction of delays may have tainted the viewing experience, amongst other controversies.

What is Video Assistant Referee (VAR)?

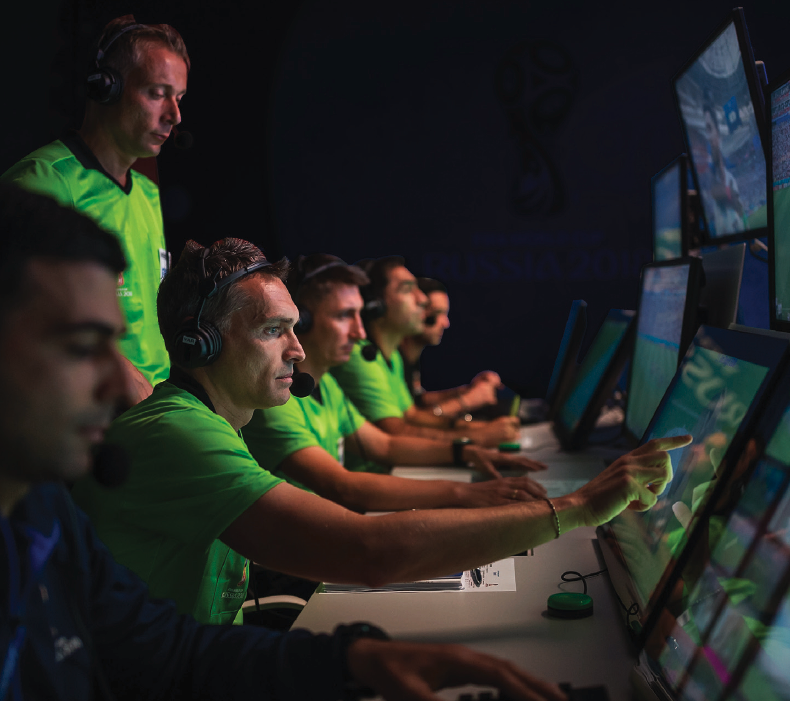
Hawk-Eye Innovations, owned by Sony, currently holds the patent for the VAR technology and are under a licensing agreements with FIFA to supply access to Hawk-Eye’s technology for top leagues around the world. This additional refereeing process consists on Video Assistant Referees (VAR) watching matches in a video operation room (VOR) assisted by an assistant VAR (AVAR) and replay operator (RO). For all Premier League matches since VAR adoption, this video operation room and all VAR officials have been based in Stockley Park in South West London.

This refereeing system is football's first broad use of video technology to reach more correct decisions. It enables referees a second chance to look at a play before deciding on the appropriate course of action. For instance, it solves the issue of diving in the box to force a penalty and also protects referees from enraged fans and players by giving them more credit, more authority, fewer mistakes and overall more robust justification when taking action against them.

Inside the VOR, VAR has access and control of TV broadcast footage and is connected to the communication system used by match officials, with either the VAR or the AVAR advising the referee if the game needs to be reviewed. VAR is also in charge of selecting the best angle and replay speed during reviews. In theory, it should only get involved when officials have made a 'clear and obvious error' in one of four key areas; goals, penalties, red cards and mistaken identity. This philosophy of “minimum interference with maximum benefit” promoted by the International Football Association Board (IFAB) in their VAR protocol hopes that the introduction of VAR won't disrupt the flow of the game.

Additional to the video operating room, the referee is able to further review a given play by entering the Referee Review Area (RRA) on the pitch side, an ‘on-field review’ (OFR) can be undertaken.

This RRA must be:

  • in a visible location outside the field of play

  • clearly marked

This area is exclusive to the referee. A player, substitute or substituted player who enters the RRA is cautioned and any team official who enters the RRA is publicly given an official warning or also cautioned with a yellow card.

VAR Review Infographic

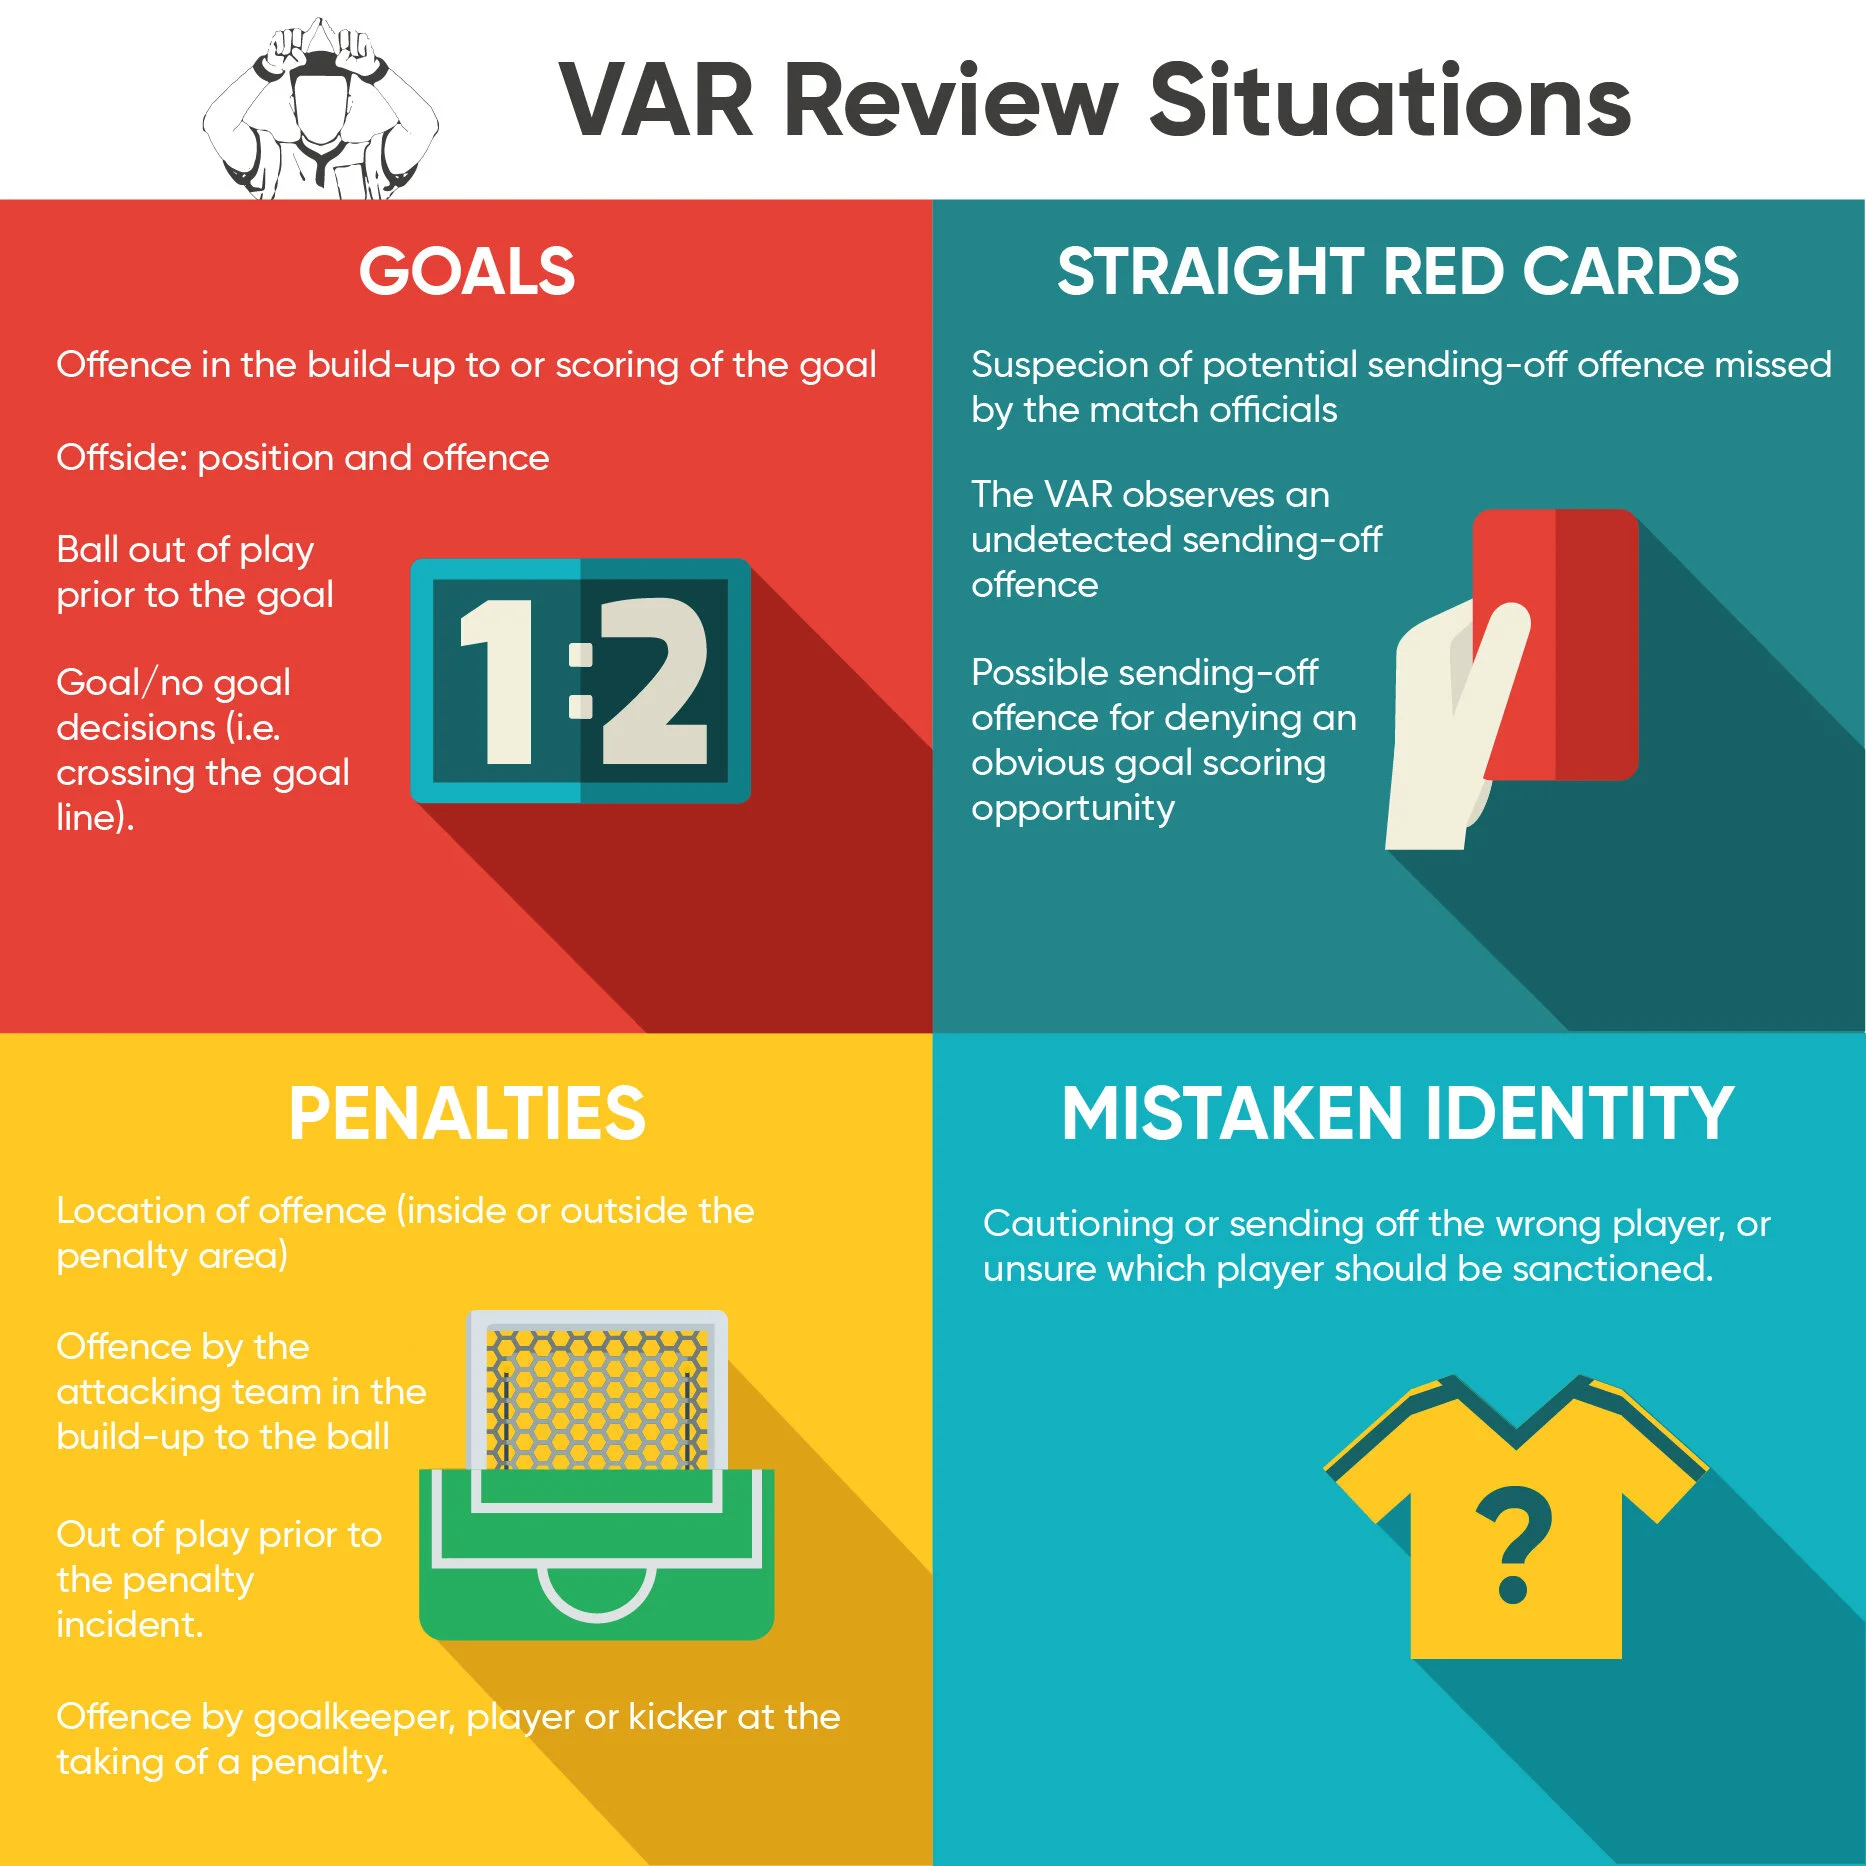
Other official criteria when using VAR includes:

  • VAR reviews are not to be used for first or second yellow cards.

  • The referee must always make a decision prior to the use of VAR.

  • Final decision is always taken by the referee.

  • No time limit: accuracy is more important than speed.

  • Players and team officials must not surround the referee.

  • Referee must remain visible during review.

  • If play continues after a reviewed incident, any disciplinary action taken during the post-incident period is not cancelled.

  • If play has stopped and been restarted, the referee may not use VAR.

  • Coaches or players cannot request a review.

Video Assistant Referee - Operating Room (VOR)

The VAR review process follows three main steps: incident, review/advice and decision. In a match situation, it would look something like the following:

  1. The Video Assistant Referees review the video footage of an incident or referee requests review. However, only the referee can initiate a formal review where play is stopped.

  2. The Video Assistant Referees advises the on-field referee through an earpiece.

  3. The referee puts his hand up to stop play if required.

  4. The referee informs the players that a decision is being reviewed.

  5. If VAR information is accepted, referee reverts decision by drawing a rectangle with their arms.

  6. When decisions are not obvious or subjective, the referee will watch a replay on a pitch-side screen (avoided whenever possible to prevent long delays).

  7. Referee decides to maintain or reverse the original decision.

On top of the general IFAB guidelines for the use of VAR, the Premier League also implemented variations with their own specific criteria. Some of these include:

  • Referees avoid on-pitch reviews at the pitch-side screen and instead have been told to trust the advice by VAR.

  • Stick to a higher threshold and only intervene when 'clear and obvious' errors.

  • Follow a softer interpretation of the handball rule when not a deliberate act of extending the arm away from the body, as oppose to IFAB’s laws that state penalties should be given if the hand or arm extends beyond the natural silhouette of the body, regardless of intent.

  • Disallow any goal in which the ball strikes the hand of an attacking player in the build-up, deliberate or otherwise.

Impact Of VAR To Modern Football

In raw statistical terms, Lago-Peña et al. (2019) found that there was a significant decrease in the number of offsides, fouls and yellow cards after the implementation of the VAR in both the Bundesliga and Serie A. This may possibly be due to a less aggressive behaviour by players due to additional officiating, as players become more careful with committing fouls, tackles and protesting. The study also found an increase in the number of minutes added to the playing time in the first half. Moreover, the number of goals and number of fouls decreased in Serie A, as so did offsides in Bundesliga and yellow cards in both competitions.

Caruso et al. (2016) also discovered that slow motion video review can distort reality and can change the way body movements and intentions are perceived. Splitz et al. (2018) asked 88 elite referees to evaluate 60 different foul play situations taken from international matches, replayed in either real time or slow motion. They found that decisional accuracy was similar in slow motion and real time, as faster speeds more closely replicate the cognitive processing demands required in dynamic and time-constrained environments. However, in situations like offside decisions slow motion might be of added value to assistant referees as they require evaluation of spatial and temporal landmarks. They also found that referees penalized situations more severely in slow motion compared to real time as viewing a situation in slow motion, compared with regular speed increases the perceived intent of a violent action. This meant that video replay speed has an important impact on the disciplinary decision given by the referee.

Moreover, adjustments to the way the rules are enforced also have behavioural influences on players and coaches. Pauses during video review allow coaches to relay information to players in a more cohesive manner. It provides them an opportunity to have an immediate input in the game, particularly during high stake scenarios. They are able to reach players directly, rather than through a captain or teammate, thoroughly explain their tactical changes and checking for understanding. This ultimately improves communication between players and coaching staff. The increased number of opportunities to introduce additional tactical inputs by coaches during VAR officiated matches enhances the importance on coaching decisions by each team at critical intervals of the match. In other words, coaches are now more capable of closely managing their players.

Attacking players may also see their game dynamics affected. Referees are now more likely to let play continue if there is a close offside decision and that could be checked later through VAR. This new scenario increases attackers’ incentive to make early runs on high defensive lines to push the limits of close offside margins. They are more likely to seek scoring opportunities as incorrect offside calls that stop attacking plays become less frequent. Ultimately, the returns on risking an offside call during attacking play, particularly when passing through defensive lines, become substantially higher.

Another study by Anik, L. (2018) evaluated how VAR influences the observers’ perceptions on quality, flow, outcome and enjoyment of matches, as well as the perception on referees’ performance, credibility and authority. She found that a referee who made the correct call without using VAR was considered more competent. On the other side, the referee’s reputation was negatively impacted when using VAR, even in ambiguous situations where he made the correct decision by overturning the original call. During these debatable situations, a referee was perceived as less competent when choosing to benefit from video technology. A referee’s use of VAR may be only beneficial to him when he confirms the decision he has already made on the field.

Assistant Video Assistant Referee

Controversy

A number of fans and pundits have argued that VAR disrupts the flow of the game. Even though IFAB encourages a “minimum interference for maximum impact” use of VAR, a general dissatisfaction exists amongst fans with the current amount of time taken to review incidents. In comparison, Rugby Union’s TMO and cricket’s DRS have proven very quick, efficient methods of reviewing play with confusion created. The perception with football, however, is that VAR has a long way to go to become as established as similar systems in other team sports.

Additionally, spectators are not always aware of when a decision is being reviewed, particularly in grounds that don't have big screens but with a loud speaker announcement. Transparency of the referee’s decision process is currently inexistent, as conversations between VAR and match officials are not broadcasted to the public, unlike video arbitrage in other sports such as Rugby Union. Gary Lineker has referred to this point in various occasions, as seen in the below interview with Danny Baker.

Another area of concern in the use of technology for refereeing is the strict and subjective nature of football's laws. For instance, goals can be disallowed for the tiniest of margins and many incidents are left open to interpretation. Despite the availability of replays, debates and disagreements about penalty and other incidents still remain. Human interpretation is still a major factor in decision making. Suggestions have emerged about now being a good time to look at the laws of the game, such as the offside rule bring redrafted to try and avoid goals being disallowed over matters of inches, claiming that microscopic analysis of offsides goes against the original spirit of the law.

Concerns about this spirit of the game are also raised regarding goal celebrations. Fans and pundits have addressed the issue that VAR reviews during goals are taking the joy out of the game because nobody can celebrate properly until VAR review is completed. This spontaneous joy of goal celebrations being lost due to the possibility of a review could become detrimental to the atmosphere in stadiums.

Other have also suggested that the lack of debate it causes amongst fans can also affect the nature of the sport’s fanbase, arguing that fans would rather a free flowing game over a perfectly refereed match where they sit in silence. This brings in the perspective of addressing the game of football as an entertainment rather than purely a sporting machine.

Lastly, in developing countries, the high cost of using the system, such as licensing fees, may restrict access to VAR technology for many leagues and divisions, thus widening the gap with more established, wealthy leagues. In Brasil, VAR was rejected due to the estimated cost per season of $6.2 million. South American and African leagues will face financial challenges adopting these new IP-protected technologies.

Citations:

  • Anik, L. (2018) How Soccer’s Video Assistant Referee (VAR) Influences Belief in Human Referees’ Competence. Behavioural Scientist. Link.

  • Caruso, E. M.; Burns, Z. C. & Converse, B. A. (2016). Slow motion increases perceived intent. Proceedings of the National Academy of Sciences of the United States of America, 113(33), 9250–9255 https://doi.org/10.1073/pnas. 1603865113

  • IFAB (2017) Video Assistant Referees (VARs) Implementation handbook for competitions. The International Football Association Board, Zurich Switzerland. Link.

  • Lago-Peñas C.; Rey E. & Kalén A. (2019) How does Video Assistant Referee (VAR) modify the game in elite soccer?, International Journal of Performance Analysis in Sport, 19(4), 646-653, DOI: 10.1080/24748668.2019.1646521

  • Lakpini, C. (2019) The Video Assistant Referee (VAR): The Patent-Protected Technology Changing the Face of Football, IP Unit, University Of Cape Town, Intellectual Property Unit. Link.

  • Spitz, J.; Moors, P.; Wagemans, J. & Helsen, W.F. (2018). The impact of video speed on the decision-making process of sports officials. Cognitive Research: Principles and Implications, 3(16), 1-10. https://doi.org/10.1186/s41235-018-0105-8

StatsBomb: Advanced Football Analytics Through An Interactive Platform

STATSBOMB is a UK-based football analytics and data visualisation company introducing common data analytics practices seen in business and tech to the world of football analytics. Through their recently launched (February 2019) STATSBOMB IQ data visualisation platform they offer immediate accessibility to valuable football insights from all major leagues and players across the globe.

The company was founded in January 2017, after self-described data geek Ted Knutson - now CEO and co-founder of STATSBOMB - traded a decade in the sports betting industry to partner with Charlotte Randall - Chief Operating Officer - and “produce the best possible analytic toolset for football clubs to use in player recruitment, team analysis, and opposition scouting”. What started as a blog sharing ideas about applied statistics in football turned into a reputable business collecting vast amounts of football data and offering an interactive visualisation platform enabling them to establish a global customer based including major clubs, federations, media, broadcasters and gambling organisations. In their ambition to establish themselves as an industry leader, STATSBOMB has recently acquired Egypt-based sports data collection company ArqamFC, gathering over 5,000 data points per match. Ted Knutson claimed that this move will allow them to offer double the amount of data points than any other provider.

STATSBOMB’s new data visualisation platform STATSBOMB IQ is the latest pioneering move by the company. Their dashboards, charts and graphs follow a similar aesthetic, clarity and data blending to those displayed by Tableau, possibly the largest data visualisation package in tech. While most, if not all, charts come already built out-of-the-box, their interactivity and filtering tools allow for sufficient customization to answer a wide range of analytical questions.

Salah’s 2018/19 STATSBOMB Profile

Salah’s 2018/19 STATSBOMB Profile

Messi’s 2018/19 STATSBOMB Profile

Messi’s 2018/19 STATSBOMB Profile

The platform has an outstanding processing performance when switching between the various sections and quickly display vast amounts of data on the screen. From player radars to shot maps, shot distributions, defensive activity, xG trendlines, corner maps and even player comparison showing similarities or complementary skill sets, STATSBOMB IQ is a reliable and robust tool offering immediate access to a complete picture of the latest football data within the click of a button.

Barcelona - Liverpool - 2019-05-01.png
Liverpool - Barcelona - 2019-05-07.png

The company also offers consultancy services to ease users into their data tools and provide them with the right assets to navigate their platform. This assistance when interpreting their large dataset - they collect more than twice the events per match than their competitors - is key in order to make their service digestible. However, the easy navigation through the clearly defined themes makes this task quick to grasp. Some of these themes include:

  • Pressure: analysing how players and teams press and how they perform under pressure

  • Shooting: including the location of attacking and defending players to provide both attacking and shot defending insights.

  • Goalkeeping: detailed actions down to goalkeeper positioning and movements that can be tied to the insights of gathered from the quality of the shot.

Cristiano Ronaldo Serie A 2018_2019.png
Lionel Messi La Liga 2018_2019.png

While the company does not intend to replace videoanalysis, it does emphase on the compatibility of their data visualisation features to reduce the time spent by analysts and coached reviewing player and team footage during performance evaluations. By spotting the right patterns and trends in the data, a more focused approach to videoanalysis can be adopted that will narrow down the areas to further investigate. One thing is certain, their stunning data visualisations bring a refreshing approach to football analytics providing invaluable insights and introducing tools to the field of applied sports analytics that are closer aligned to today’s available technologies.

StatsBomb IQ Platform.jpg

Scout7, a bespoke software for scouting

Scout7 is one of the platforms offered by Opta to help decision making in the global recruitment and development of players. It offers clubs performance data on over 520,000 players across the world and the ability to watch over 3 million minutes of video footage on their performances. The advantage of Scout7 over similar platforms is that it is usually integrated in a bespoke manner into the club's systems, allowing it to be tailored differently for each club according to that club's needs.

More than just an extensive player database, Scout7 allows clubs across the general management of their data by providing them with clear organisation and access to their information and support various departments' needs. Under the umbrella brand Intelligent Sports Framework, the Scout7 platform offers three different services to not only help with scouting but also improve the video databases for the clubs as well as provide tools for training and player development. The iSF platform is constituted of ProScout7, Scout7.tv and TrainingGround, each offering a different set of features to complement the overall software. iSF enables a scouting team to create their own custom report templates and live data widgets so that the information most frequently needed can be accessed almost immediately.

Scout7 captures their own data from matches and players across the world that can be easily accessed by scouts through Scout7.tv, where Scout7 uploads all their high definition footage. Scout7.tv also offers many advanced filtering options to find specific players or game, analyse game statistics and also create your own clips of interesting players. On top of that, the data can be augmented with other compatible third party integrations if the club needs to do so, converting it in an even more complete platform for scouting. 

It is with ProScout7, another piece of Scout7's overall platform, where all the scouting information and actions take place. ProScout7 is a management system for scouting reports and assessment of players, where information can be flagged and shared to the rest of the scouting department for further analysis or decision making. In this section, scouts can create recommendation lists of players they wish to flag and rate each of the players the club wishes to pursue. These lists and player ratings can also be archived for later use. Similarly to Scout7.tv, scouts can also use advanced search functionality to find players of certain criteria and characteristics they are looking for, and compliment their assessments with reports from the Scout7 team themselves to consolidate a more complete view on particular players.

Lastly, the TrainingGround platform from Scout7 aims to take a more internal look at the club's current players and support coaches with development and injury prevention. From basic functionally such as planning training drills and reporting on performance of the team's matches to capturing physiological data of each player to run comparisons and deeper analysis as well as keeping a health record of injuries and treatments. While TrainingGround offers a simpler set of tools than ProScout7 and Scout7.tv, it demonstrates the attempt Scout7 is making to become the sole platforms for day-to-day club management in all areas and departments. Thanks to their close collaboration with the clubs due to its tailor-made integration of Scout7, they can find technological gaps in other areas of the club, get valuable feedback directly from the team and go back and build solutions that fit exactly those needs.

LEARN MORE ABOUT SCOUT7

GPS technology in professional sports

Global Positioning System technology has been used in professional sport for some time, in both training sessions and during competition. Through the use of Electronic Performance and Tracking System (EPTS) devices, teams can track player’s movement on the pitch and collect vast amounts of data on their performance; such as their running speed, distance run, their position on the pitch, their heart rate and their body's work rate.

These 'wearable' devices and the data they collect have multiple uses, one major of them being the prevention of injuries. By tracking a player's sprints and distance covered the coaching staff can determine whether such player is fit for their next game or could benefit from resting. According to Taylor from iSportAnalysis (2017), studies have shown that when athletes train at a higher rate than the season's average there tend to be more injury occurrences. An increase in training and game-play intensity without adequate recovery can results in an increase of injury rate. Coaches can now predict and prevent player injuries by monitoring these patterns from the GPS metrics obtained, and can make the right decisions by knowing whether their player is over training, whether they need a rest or whether they are in peak condition.

gps tracker

However, GPS is not only used to track a player's health and fitness. The value of the data collected through these EPTS devices goes beyond that. This data can also map a player's positioning on the pitch to help identify the most frequent spaces covered and provide insights on how well various areas were utilised. This can then provide a valuable source of information to adapt training and development of specific players according to their physical and tactical needs.

The type of data captured by the GPS trackers can vary largely by provider and the needs of the team using the data. As with most areas in performance analysis, the data captured by GPS needs to be used and analysed appropriately in the context of the sport, athlete or situation. An isolated data point can only provide very little insight on what is really happening, if any at all. This is why the use of GPS metrics require the combination of multiple variables in order to obtain a complete picture. For instance, two athletes may run the same distance at the same average speed, but taking a look at heart rates or speed intervals can provide a closer look into their fitness and amount of amount of load each body is taking to deliver that outcome. The most common data point being collected are:

  • Total distance covered

  • Average running speed

  • Total running distance (high pace)

  • Total sprinting distance (full speed sprinting)

  • Average acceleration time

  • Average deceleration time

  • Heart rate (to identify athlete's work rate)

  • Positioning on the field

  • Time of high intensity play

  • Time of low intensity play

  • Athlete's load (the demand on an athlete's body)

  • G-Force / impact data (for impact sports like rugby)

There are various providers of GPS technologies offering devices and services to professional clubs and athletes. One of the technology providers is Exelio, which sells its technology under the brand name GPEXE and partners with clubs such as AC Milan or AS Monaco. Their strength in the market can be attributed by its 20 Hz device frequency, much higher frequency devices than that of most of its competitors. With this high frequency GPEXE achieves a higher accuracy of information when tracking a player's changes in speed and direction, something a lot of providers struggle to do with lower frequencies. However, there are many important players in the GPS Sport technology industry partnering with elite sport clubs:

  • Catapult

    • Partners with: Bayern Munich FC, Paris Saint Germain FC, Wales Rugby and NFL's Steelers, amongst others.

  • PlayerTek

    • Partners with: Liverpool FC, Celtic FC, Wigan Athletic FC and Malmo FF, amongst others.

  • StatSport

    • Partners with: Tottenham Hotspurs FC, Portugal FA, Manchester City and West Ham United, amongst others.

  • GPSports

    • Partners with: Real Madrid FC, Chelsea FC, Atletico Madrid and Spain FA, amongst others.

  • GPEXE

    • Partners with: AC Milan, Inter Milan, Sampdoria and AS Monaco, amongst others.

Historically, acquiring this technology was cost-prohibitive for most teams, even at professional levels. However, as technology advances these devices are becoming more budget-friendly allowing more teams to adopt them for their training sessions and player development. Some lower league clubs are even loaning the technology from the providers in exchange of free usage of the data collected for research and development to improve their products.

statsports.jpg

These wearable pieces of equipment are normally placed on athlete's torsos. They are composed of various sensors to track different types of metrics and allow to store and transfer the data to a common data repository. According to SimpliFaster (2017), there are 4 types of sensors used in Player Tracking devices today: an accelerometer, a gyro, a magnetometer and a GPS module. Each sensor has a unique function that compliments the role of each other sensor. For instance, an accelerometer measures the changes in rates of perceived forces while a gyro give the data from the accelerometer direction by using the Earth's gravity. Similarly, the magnetometer will use the Earth's magnetic field to also provide direction to the data from the accelerometer. On top of that, the GPS module completes the data with satellite-positioning information.

However, no modern tracking device has been proven to be 100% accurate and reliable. An example of that is that these torso devices may be missing important information about the center of gravity of each athlete. Also, the data captured may often be indicative rather than factual due to the limitations of GPS accuracy today. Advances in technology will show an improvement in coming years on these devices and their reliability. Not only by extending battery life or reducing the size of the wearable equipment but developments in sensors and data capturing technologies will drive the future of GPS tracking in sport. For example, foot sensors are currently being explored and can prove to provide a lot more precise information of the forces and gravity of each athlete.

An overview of Dartfish, a powerful videoanalysis software

Founded in Switzerland in 1999, Dartfish is a videoanalysis solution that allows analysts to capture, analyse and share videos of training sessions and matches. The software offers tools to capture the footage directly into the platform, tag events real-time, and upload, organize and share the various videos produced. A video is displayed with the match footage on one of the screens with a panel of tags and codes next to it where an analyst is able to visualize instantly key actions identified and underline what the action reveals.

Source: Dartfish.com

Source: Dartfish.com

Dartfish offers a complete set of features for analysis in many different sports. Analysts are able to tag, review and edit actions seen in the footage in real-time while continuing to record events that continue to take place. Report creation tools are then used to identify certain patterns in actions in order to sport strengths and weaknesses and better define an athletes or team's strategy. The software is also great for video highlights, with ability to playback and zoom in key actions and add tables, lines and any other shapes into the footage for clear presentations.

While Dartfish has a built-in capture system, it also enables you to import footage from other sources from a wide range of devices. It supports multiple video formats such as Mpeg-4, h.264 and even 4K videos. Their most complete solution also allows you to record video from static IP cameras around a playing ground. Once the video has been captured or imported, the trim and time-shift tool allows you to edit and replay certain parts of the footage before starting to code it.

During video analysis, aside from basic drawing features such as freehand, line, circle, rectangle and arrow, Dartfish allows you to create slowmotion highlights, fast-forward/fast-rewind the less important sections, zoom in relevant parts of the screen and create snapshots of key moments. But it is feature such as their split video analysis when playing to moments simultaneously, as well as the measuring of angles and automatic tracking of trajectories, that make Dartfish standout as a powerful video analysis platform.

Dartfish is a flexibile and adaptable platform as the interface can be modified to each analyst's preferences and needs. An analyst can define his or her own tagging panel by identifying the right keywords to use as tags and assigning them a particular button in the keyboard. Tabs and boxes can also be created with multiple panels for different tagging functions. Tagging can take place either through an imported video or live as the video is being captured.

Once the footage has been imported and tagged completed, Dartfish offers reporting capabilities to analyse the relevant highlights that have taken place. The software summarises frequency and duration data in stats tables and graphs of the different tagged events to provide a quantitative summary of the match or training session. It also allows analysts to apply multi-criteria filters and create various playlists and montages for future reference. All these videos can then be exported or shared via the cloud with coaches and athletes.

The Dartfish software comes in four different packages:

  • Dartfish Mobile for $5 a month

  • Dartfish 360 for $20 a month

  • Dartfish 360 S for $40 a month

  • Dartfish Live S for $70 a month

Find out more about Dartfish

Opta Sports: the leading sports data provider

Launched in 1996, Opta Sports has been the major player in data collection and distribution in sports for over two decades, offering statistical information and player performance data from major sport leagues all over the world to media clients and clubs themselves. After transferring ownership several times over the years, in 2003 Opta was acquired by Perform Group, a sports media company based in the UK who also own other brands such as Goal.com and Sporting News Media in the US. Perform Group itself is owned by Ukrainian businessman Len Blavatnik through his privately held multinational industrial group called Access Industries.

With over 400 employees around the world, Opta collects data on 60,000 fixtures a year across 30 different sports in 70 countries. While football is their main business, the company also collects data for rugby union, rugby league, cricket, american football, baseball, basketball and ice hockey. Their data varies in the level of complexity and depth, from simple live scores to augmented data through statistical modeling. They classify their data offerings in four different tiers:

  • Core: live scores, updates and post-match content

  • Classic: team and player-level aggregated data and statistics

  • Performance: the most detailed and accurate level of data

  • Advanced: analytical assessment and modelling on augmented data

But how do they collect all this data? Opta hires teams of full-time and part-time analyst to watch every single game that takes place and, with the use of their data collection video software, notate all the various events that occur on the field, often capturing up to 2,000 pieces of data per match. Opta's data collection software operates similarly to a video game, where each combination of buttons will represent an action by a certain player allowing the analyst to press the appropriate combination of buttons as they watch the live game. Three analyst will be involved in each game: one for the home team, one for the away team and a third one to double check the data. The data is then checked by a post-match team to ensure 100% accuracy.

Once the data has been collected, Opta offers different methods to distribute the data to its clients, such as feeds, widgets and apis. Feeds are one of the most popular method due to the level of flexibility and detail Opta can offer depending on its client's requirements, whether is live or historical data in a number of different formats. While Opta don't expose their feeds pricing structure, presumably to be able to adapt it based on client needs, it is suspected that it can range between £500 to £2,000 in a number of cases. However, pricing is stablished case by case and is highly negotiable. Opta takes into consideration whether it can form a strategic partnership with the client (ie. size of the business requesting the data), revenue model, type of data requested and other various factors before determining a final price for their feed service.

Aside from their raw data collection and distribution, Opta is also pioneering the development of new ways to look at sport through the creation of new metrics to augment the data captured. Their most popular metrics so far has been xG (expected goals), where they provide a value to a specific shot, or group of shots, to determine the likelihood of the shot being scored based on historical data of similar shots. In a similar fashion, they expended xG to create xA (expected assists), to identify the likelihood of a pass becoming an assist in an goalscoring opportunity. However, their most recent developments are sequences and defensive coverage. Sequences refer to the passage of play that takes place from the moment possession is gained to when it is lost, including by a shot on goal. Within sequences, they also look at possession, which is the number of consecutive sequences the team has without losing control of the ball (ie. a shot that ends up in a corner for the attacking team will mean 2 sequences in 1 possession). In terms of defensive coverage, Opta has developed a metric to measure the area of defensive actions by a player during a match.

Opta has established themselves as the leaders in football, rugby and cricket data around the world. Their client portfolio continues to expand and they are now working with major sporting organisations from media to clubs. Some of their most memorable partnerships include Sky Sports, Arsenal FC, Real Madrid, Manchester City, the MLS, BBC Sport and the All Blacks, amongst many others.

Performance Indicators in Football

Micheal Hughes et al discussed in 2012 in their article "Moneyball and soccer - an analysis of the key performance indicators of elite male soccer players by position", how team sports like football offer an ideal scope for analysis thanks to the numerous factors and combinations, from individual to teams, that can be used to identify performance influencers.

READ HUGHES M.D. ET AL'S FULL ARTICLE HERE

The article suggests that, in a sport like football, in order for a team to be successful, each player must effectively undertake a specific role and a set of functions based on the position the play in on the field. Through a study carried out with 12 experts and 51 sport science students, they aimed to identify which are the most common performance indicators that should be evaluated in a player's performance based on their playing profile. They started by defining the following playing positions in football:

  • Goalkeeper

  • Full Back

  • Centre Back

  • Holding Midfilder

  • Attacking Midfilder

  • Wide Midfielder

  • Strikers

Each performance indicator identified by position would be then categorized into the following 5 categories:

  • Physiological

  • Tactical

  • Technical - Defensive

  • Technical - Attacking

  • Psychological

Through group discussions between the experts and the level 3 sport scientist, they came up with the following traits required for each of the above positions.

Source: Moneyball and soccer by Michael Hughes et al (2012)

Source: Moneyball and soccer by Michael Hughes et al (2012)

The study identified that most performance indicators of outfield players were the same across position, with only the order of priority of each PI varying by position. Only goalkeepers had a different set of PIs than any other position. While these classifications of skills by position were done in a subjective method (ie. group discussion), it is a good first step towards the creation of techno-tactical profiles based on the players position and functions on the field, as pointed out by Dufour in 1993 in his book 'Computer-assisted scouting in soccer'. The above table provides a framework in which coaches and analyst can further evaluate the performance of players in relation to their position. However, tactics and coaching styles or preferences may cause the order of priority of each PI within each category to vary by team. The article also suggests that a qualitative way of measuring the level of each performance indicator should be used to evaluate a particular player.

The above suggests that positions may play a key role when assessing performance in footbal. From a quantitative perspective, when analysing the performance indicators to determine success or failure, or even to establish a benchmark to which to aim for, there are several metrics an analyst will look to gather through notational analysis:

Technical:

  • Shooting game

    • Total number of goals

    • Total number of shots

    • Total number of shots on target

    • Total shot to goal scoring rate (%)

    • Total shot on target to goal scoring rate (%)

    • Shots to goal ratio

    • Shots on target to goal ratio

    • Total number of shots by shooting position (ie. inside the box)

    • Total number of shots by shot type (ie. header, set piece, right foot, etc.)

    • xG (read more)

  • Passing game

    • Total number of passes

    • Total pass completion rate (%)

    • Total number of short passes (under X metres away)

    • Total short pass completion rate (%)

    • Total number of long passes (over X metres away)

    • Total long pass completion rate (%)

    • Total number of passes above the ground

    • Total chip/cross pass completion rate (%)

    • Total number of passes into a particular zone (ie. 6 yard box)

    • Total zone pass completion rate (%)

    • Pass to Goal ratio

    • Total number of unsuccessful passes leading to turnovers (ie. interceptions)

    • Total pass turnover rate (%)

  • Defensive game

    • Total number tackles

    • Total number of tackles won

    • Total tackle success rate (%)

    • Total number of tackles in the defensive third zone

    • Total number of tackles won in the defensive third zone

    • Total number of fouls conceded

    • Total number of fouls conceded leading to goals conceded (after X minutes of play without possession)

    • Total number of pass interceptions won

    • Total number of possession turnovers won

Tactical:

  • Attacking

    • Total number of set pieces

    • Total number of attacking corners

    • Total number of free-kicks (on the attacking third zone)

    • Total number of counterattacks (ie. based on X number of passes between possession start in own half to shot)

    • Average duration of attacking play (from possession start to shot)

    • Average number of passes per goal

  • Possession

    • Total percentage of match possession (%)

    • Total percentage of match possession in opposition's half

    • Total percentage of match possession in own half

    • Total number of possessions

    • Total number of non-shooting turnovers

    • Ratio of possessions to goals

    • Total number of passes per possession

    • Total number of long passes per possession

    • Total number of short passes per possession

  • Defensive

    • Total number of clearances

    • Total number of offsides by opponent team

    • Total number of corners conceded

    • Total number of shots conceded

    • Total number of opposition's passes in defensive third zone

    • Total number of opposition's possessions entering the defensive third zone

    • Average duration of opposition's possession

It is important to note that teams may adapt both their tactics and style of play based of the various circumstances they face in a game. For example, a team scoring a winning goal in the last 10 minutes may chose to give up possession in order to sit back in their defensive third during the remaining of the game. When using quantitative analysis to determine the success or failure again the performance indicator, it is important to take context into consideration for a more complete and accurate analysis.

Notational analysis: a synonym of today's performance analysis

While motion analysis and biomechanics constitute important areas in performance analysis, one of the most popular and fundamental pieces of performance analysis in sport is the use of notational analysis. Notational analysis is the identification and analysis of critical patterns and events in a performance that lead to a successful outcome. Hughes (2004) defined notational analysis as "a procedure that could be used in any discipline that requires assessment and analysis of performance". The information used for notational analysis is usually gathered by observing a team's performance in a competitive environment. By notating numerous events that take place on the pitch, such as striker positioning, defenders' tackle success rate or midfielders pass completion rate, an analyst can identify strengths and weaknesses and provide these results to coaches who then use them to adapt training sessions or share accurate feedback with players and the entire team.

The importance of notational analysis comes from the limited recalling ability that coaches, as human beings, have when remembering specifics of the performance of their teams, and how these can be biased by their beliefs and other motives. As Hughes and Franks described, by receiving objective data of what happened during a game, a coach can make a more informed decision by enhancing his or her abilities to accurately assess the events of a game and improving the quality of feedback he is able to provide to the players. A big miss by a striker might be recalled by coaches and other players more vividly than the same's striker effective positioning or successful dribbling in the same game. At a professional level, we often hear pundits and fans rate a player's performance in a game based on a small number of noticeable actions that took place, such as a missed penalty or a defender's mistake that led to a one-on-one chance by the opposition team. However, through notational analysis, a more complete view of that player's performance may provide a more accurate perspective on the players contribution in the game and inform any future decisions towards that player, such as training structure or upcoming match presence.

Different teams in different sports will define their own frameworks of performance indicators that allows them to identify the areas in the game they are most interested in evaluating. This means that there is a wide range of information that is captured today in notational analysis depending on the environment the analyst is working in. This is in part due to the lack of a common set of performance indicators being identified as the key to sporting success, particularly in team sports where it is practically impossible to account for every single events that could lead to winning a match. A football team may consider percentage of shots on target, possession percentage and pass completion rate to be their performance indicators to benchmark themselves against for a game, while a different team in the same sport may want to consider possession percentage on the opposition's last third, defensive tackles won and total number of shots. As Hughes stated in 2011, while all these may be considered valid information to collect, the lack of a common framework across sport may be slowing down the research and analysis to develop notational analysis further.

There are certain challenges in notational analysis, particularly when it comes to live events. A single analyst notating events and patterns in real time may be subjected to human error or miss certain actions. This is why most sport statistics companies and elite sporting organisations employ several analysts to collect the same performance indicators on a live game, allowing to compare notated statistics between analysts with the purpose of improving the accuracy of the data collected. Another challenge of the notational analysis process is subjectivity, were events notated that have a certain degree of ambiguity may be captured differently by different analysts. While notational analysis aims to add objectivity when evaluating a team's performance by quantifying the events, it is possible that the definition of such events may change depending on the interpretation the analyst capturing the event has on that action.

During the last two decades, a large number of new technologies have developed the methods and effectiveness of notational analysis in sport. While traditional analyst often used a pen and a notepad to notate all the various events they considered relevant, technologies like Opta, Dartfish or Sportscode have become a central asset for notational analysts in the industry. The use of a video camera and a video analysis software can now provide analyst with a wide range of features and tools to collect as much information as they require to assess performance against specific performance indicators.


An overview of Sportscode, a key video analysis platform for performance analysts

Sporstcode is one of the leading video analysis software in the performance analysis field today, used by thousands of analysts, coaches and athletes around the world. This popular platform goes as far back as 1999, when Australian coaching applications and professional services company Sportstec first launched the first version of the revolutionary video software. However, in 2015, the company was acquired by the American counterparts Hudl in an effort to strengthen the companies position in the industry by combining the elite-level sport market dominance of Sportstec with the broader reach within amateur and grassroots level of Hudl, as stated by former Sportstec Managing Director Philip Jackson (PR Newswire, 2015).

The platform allows analysts and coaches to visually identify what went well and what could be improved in a training session or game by providing a quick and easy way to create interactive reports linked to key highlights. The process is very simple: capture your video into Sportscode, code the different events that take place in the footage, evaluate the results of the relevant events captured and present the insights to coaches and athletes. However, the platform offers a very wide range of functionalities and features that require some time to get familiarized with before being able to effectively use it.

Capturing and Uploading Video

With Sportscode you can capture video live, uploading it into the platform in real-time and from multiple angles when using multiple cameras, to then code the recorded footage by tagging all the relevant events to later analyse. With the most recent version released in 2017, you are even able to capture video from a remote IP camera, allowing the capture of angles that are impossible or impractical to collect through a lift or tripod camera. This is particularly important for sports where teams are spread out across the field, as focusing on a specific area of the pitch may not capture players standing outside the angle of reach.

Coding the video footage

Once the video has been uploaded into the platform, Sportscode provides analysts with enough flexibility within their set of features to define what code windows suit best the KPIs of their team. In this coding process, analyst can define the text, colour, size and alignment of their tags, create filters to play back key moments, define the length and category of each event, execute calculations of the data as it is being coded and more. The analyst will start by defining the codes, flags and labels they will want to track in the video footage and then run the video while indicating which relevant tags apply for each section of the video based on the actions and events that take place.

Analysing the events captured

Aside from tracking the numerous events from a game or training session, Sportscode also allows analysts and coaches to evaluate a particular play of action with interactive visualizations and drawing features. Plays can also be played back from multiple angles, if they were captured in such way, and multiple games can be combined into one unique video if the purpose is to analyse a specific style of playing across various matches. While Sportscode is primarily a video-centric software, it also offers the ability to generate quantitative insights based on the events tracked in the footage and produce spreadsheet style reports. These reports can be shared remotely and in real-time with coaches as the insights are generated to allow for quicker reaction and decision-making.

Presenting and sharing the results

Once the video has been captured and coded, highlights have been generated and the analysis has been completed, Sportscode allows you to export the final video with all the information to share it with coaches and players. This can be done in the form of individual videos or even playlists with groups of videos sorted by different categories. These video presentations can also include notes and commentary on relevant highlights for a more detailed review.

LEARN MORE ABOUT SPORTSCODE HERE

The Brentford FC story: running a football club through data

In 2012, professional gambler, betting businessman and lifelong fan Matthew Benham saved Brentford FC from bankruptcy by paying the £500,000 debt the club owed. Since then, he has invested over £90 million in improving the team's training facilities, stadium and developing a youth academy that looks after every young player's academic and sporting development needs.

But aside from investing money in the club like many other club owners do, what Benham also brought to Brentford was a revolutionary analytics culture to every aspect of the club. He removed the idea that results should drive decisions, but instead use the evaluation of key performance indicators to make any recruitment decisions. When looking for his next striker, the club would now look at the number and quality of chances that player creates and how the collective performance of the team, whether it is offensively or defensively, affects the performance indicators of such player. It is by consciously doing things differently that Benham attempted to take a small club like Brentford to be able to compete at the highest level against clubs with a lot larger budgets.

Implementing a new pioneering approach to looking at the sport like the one Benham wanted for Brentford does not come easy in the world of football. Resistance of fans, and even coaches, to let go of traditional believes by holding on to the use of acquired wisdom for decision-making was something Benham had to face. In 2015, Benham sacked successful manager Mark Warburton after Warburton had won the club promotion to the Championship the prior season and the team was by then in a healthy league position. It was openly discussed that Warburton had fundamental philosophical differences with the changed structure in which Brentford FC was being run. The mathematical modeling methods that were being applied at the club, particularly in the club's scouting practices, conflicted with the football believes of a more traditional manager like Warburton.

stadium-2746118_640.jpg

As journalist Tim Wigmore clearly explained in his article for Bleacher Report in 2017, another unorthodox and tough decision Benham had to make was around the youth academy. Since 2005, no academy player had debut in the first team. Not only that, the best talent being produced by their academy was being stolen away by top clubs in the Premier League at young ages when Brentford was not due compensation for the transfer. The situation meant that the large investments being made in developing young talent were not returning any positive results to the club. This is why Brentford FC decided to completely close their academy and solely focus on recruitment from other clubs. They also created a B-team consisting of players previously rejected by other clubs and overseas players looking to trial in English football. They switched from being a feeder club of young talent into larger rivals to partnering with them for the release of the other club's surplus assets for a small fee. With a B-team as a stepping stone into the first team, the club ensure a the have a plan of succession and a place to develop talented players regardless of their age.

The approach to the recruitment of players at the club also changed. They started to follow a stock market type approach when evaluating which players should be signed, almost looking at them like appreciating and depreciating assets and taking into consideration market inflation in different countries. They aim to hire young and undervalued players that had the motivation and energy to develop further, even though that sometimes causes conflicts between short and long term planning. To do so, they employ statistical modeling to analyse player performance, particularly focusing in leagues across Europe where the markets are less inflated but player quality levels may exceed those in the Championship. 

Evaluating team performance also changed drastically at the club. Brentford are big fans of models like xG, and use those to obtain a potentially different view to the existing league table position and match results. They argue that this takes away the luck factor that can influence football results and instead looks at the quality of performances the team is having with an eye in the long term sustainability of the club. They do so to avoid the traditional rash decisions often made in football, especially around sacking a manager for a poor run of results. After the previously mentioned disagreements with Warburton, Brentford hired Dean Smith as their head coach who was fully onboard with the club's innovative philosophy and is now one of the longest-serving managers in the league.

The Telegraph also explained in 2016 how tactics and training also experienced a change in dynamics with the implementation of analytics at the club. They found that in football, teams don't pay enough attention to set piece, even though they may constitute up to a third of a team's goals. They decided to place more emphasis in these areas during trainings and even hired specialised set pieces coaches to improve on them. This resulted in a more planned approached to taking set pieces that ultimately led to more goals.

The long-term philosophy that Brentford FC have been implementing over the last 6 years generates excitement around the football analysis community that is hoping to see a club being run by analytics, sound business strategy and statistically-based decision making can make their breakthrough into the Premier League in the coming seasons. In the 2017/18 season, they were only 6 points away from promotion play-offs.

Performance Indicators in Rugby Union

In 2012, Michael T Hughes, Michal M Hughes, Jason Williams, Nic James, Goran Vuckovic and Duncan Locke wrote an insightful academic journal discussing the performance indicators in rugby union during the 2011 World Cup. They gathered various materials from professional analysts working for coaches and player at the World Cup event, and verified the reliability and accuracy of their data against video footage from different matches.

READ FULL JOURNAL HERE

rugby-655027_640.jpg

This research study analyses the influence of the following key performance indicators in the final outcome of a game:

Scoring Indicators: 

  • Points scored

    • Total points scored in WWC 2011

    • Points scored per game

    • Points scored agains Tier A teams

    • Points scored per game against Tier A teams

  • Tries scored

    • Total tries scored in WWC 2011

    • Tries scored per game

    • Tries scored from set pieces

    • Percentage of tries scored from set piece

    • Tries scored from set pieces per game

    • Tries scored from broken play

    • Percentage of tries scored from broken play

    • Tries scored from broken play per game

Quality Indicators:

  • Total Possession - Times and Productivity

    • Minutes that ball is in play in the match

    • Rest minutes in the match

    • Minutes with possession in the match

    • Percentage of time with possession

    • Number of possessions in the match

    • Minutes per possession

    • Minutes of possession per point scored

    • Number of possessions per point scored

    • Minutes of possession per try scored

    • Number of possessions per try scored

    • Total number of line breaks

    • Total number of line breaks per game

    • Minutes of possession per line break

    • Number of possessions per line break

    • Total number of set piece line breaks

    • Total number of set piece line breaks per game

    • Percentage of set piece line breaks

    • Total number of broken play line breaks

    • Total number of broken play line breaks per game

    • Percentage of broken play line breaks

    • Number of phases in the match

    • Percentage of phases per possession

    • Attacking penalties won

  • Attacking Possession

    • Number of possessions in opposition's 22 line

    • Number of converted possessions in opposition's 22 line

    • Percentage of converted possessions in opposition's 22 line

    • Number of points from opposition's 22 line

    • Number of points from opposition's 22 line per game

    • Number of points per possession in opposition's 22 line

  • Kicking game

    • Total number of kicks at goal

    • Total number of kicks converted

    • Percentage of kicks converted

    • Penalties conceded

While these key performance indicators of a rugby union game or tournament can be useful to summarize the some elements of a team's performance, what M. Hughes et al (2012) found was the there was little correlation between each individual metric, or set of metrics, with the final outcome of the World Cup 2011 tournament. For example, France was identified as one of the worst teams in most of these metrics, though they were the runners-up of the tournament.

quino-al-406222-unsplash.jpg

The paper also touches on the challenges individual player performance analysis in rugby union. Due to the nature of the sport, a specific position on the field will require its own set of performance indicators. The study suggests to analyse an individuals performance against common key performance indicators and use that individual's performance profile to run intra-position comparisons (Hughes et al, 2012). This also leads to the creation of position profiles, where strengths and weaknesses of players playing in each position can be identified. It is also suggested that the individual player profiles should be based in the context of the team's profile as well as the opposition team's strengths and weaknesses, as these elements will impact a player's performance profiling.

Similarly to most team sports, randomness and luck can play a big part in the final outcome of a rugby union match. Therefore, predicting the performance of a team based on a few data points might not be enough to correlate it to the final performance achieved by that team. There are many complex interactions that occur during a rugby union game between teammates and oppositions which are difficult to account for through today's available statistics. However, studies like the one carried out by Hughes et al (2012) are another step towards narrowing down the best procedures to follow to successfully apply analytics to rugby performance predictions and team sports in general.

The effect of GDPR in sports performance analysis

On 25th May 2018, a new Global Data Protection Regulation launched in the EU, significantly improving the control European citizens have on their personal data collected by third parties. While GDPR covers many complex areas around the subject of data collection, storage and transfer of personal data by third parties, the key topics that are normally highlighted when discussing this new regulation are that an individual must now provide consent prior to a third party collecting data about themselves and that said individual has also the right to request the data collected to be deleted at any point in time, as well as to revoke any prior consent given to collect personal data.

How does the new regulation affect sport organisations?

Like any other company in any industry, sport clubs and organisations also require to reassess the data they collect from their fans, volunteers, employees and any other member of the club. No organisation that collects and stores personal data of an EU citizen, even in sports, is exempt of the €20 million or 4% of yearly turnover fines if they are found noncompliant.

One of the biggest changes a club now needs to manage is around fan collected data, often used to increase fan engagement and delivering marketing campaign to grow the club's fan base. Like many marketing departments in numerous organisations collect a wide variety of information about their customers, such as interests, personally identifiable data (PII) purchase history and any actions individuals take on websites and physical events they attend, such as a football match. Clubs need to reevaluate the level of consent they receive to continue to store and collect all this data points about their fans and prospective supporters. Similarly, GDPR applies to the employer-employee relationship and data sharing. This means the clubs will also require consent from players, coaches and members of staff.

Aside from evaluating their data management and applying new procedures, clubs will also require to be able to demonstrate compliance by updating and making public their data privacy policies and new processes they put in place for GDPR. This includes clearly informing how individuals can request their data store, update it or remove it altogether, as well as the steps to follow to revoke consent if they wish to do so.

And how does it affect Sport Performance Analysis?

Player profiling is one of the various key tasks of a performance analyst. It can involve either evaluating your own player's performance or assessing the players from the rival club the team will be facing on their next fixture. An analyst would gather data on the player's recent performances, strengths, weaknesses and playing styles to compile detailed reports to present to the coaching team.

In Article 22, GDPR tackles profiling directly as it refers to it as building up a picture of the type of person someone is by evaluating certain personal aspects relating to a natural person’s performance at work, economic situation, health, personal preferences, interests, reliability, behaviour, location or movements. However, the new legislation also specifies that consent is only necessary if automatic decision-making is applied based on this profiling, and also only if such automatic decision-making creates any legal effects or significantly affects the individual in question. This means that the simple task of profiling should not require the consent of the individual unless sensitive personal data, such as health, race or other sensitive data, is collected during profiling.

This suggests that player profiling in sports can be interpreted as not requiring the player's consent. Firstly, decision-making based on profiling in this scenario is not an automatic one. This means that even though player profiles are collected to make decision on tactics, training session preparation or recruitment, there is always a element of human review of such profiles, usually by the coaching team, which could rule out the classification of this processes as being for "automated decision-making" as required in order to apply to GDPR guidelines. Secondly, the profiling carried out by analysts should not have any legal effects or significant affect the individual being profiles. The human intervention in reviewing these profiles also backs up this argument, as no "automatic" effects are generated by this activity.

There is, however, a counter-argument worth considering, and that is around the sensitive nature of the data used in profiling. Player profiling can include sensitive information about the player in question, particularly around his or hers health. Injuries are bound to appear in a majority of player profiles generated by analysts, particularly if the goal is to optimize injury prevention. In such cases, consent is required to be provided by the player as the profiling now contains sensitive data of that natural person. It is also worth considering the application of GDPR in the scouting of youth talent, were profiling is carried out by gathering data on minors where parental consent should be obtained. Data collected from minors cannot fall be considered as having a legitimate reason for gathering such information without prior consent.

Navigating the complex world of GDPR is undoubtably challenging for many teams and analysts. However, it is important to know the scenarios when consent is required to produce a piece of analysis involving player data and when, as Articule 6(f) states, there is a "legitimate reason" to collect data without consent. Nevertheless, while consent might not always be required, it is always important to evaluate the scope, transparency and long-term purpose of the profiling process before assuming no consent is required. This can include areas such as the player's right to decline their data from being collected and request the deletion of any previously collected data. One way or another, a performance analysis team now needs to consider the implementation of new processes around data management in their day to day roles.

How Wyscout has evolved football scouting

Wyscout initially launched in 2004 in Italy as a Football Match Analysis and Advertising provider, amongst other minor services the company offered. It was not until 2008 when they launched their first user interface to offer access to their footballer database containing basic stats such as weight and height of players. Since then, the platform has experience rapid growth and popularity in the world of football and particular in the scouting field.

By 2012, Wyscout had captured videos and statistics of over 200,000 players around the world and was now actively being used by 300 professional clubs and 15 national sides, as reported by The Guardian newspaper right before the opening of the 2012/13 season's winter transfer window. Wyscout had established themselves in the forefront of worldwide scouting, ending with the most traditional methods historically used where scouts went to view players across the world with a notepad. With a platform like Wyscout, all the information and video footage they needed to know about their next multimillion signing or future youth academy star was as far as the click of a button.

wyscout image.jpg

However, as CEO of Wyscout Matteo Camponodico points out, the platform is not intended to replace scouts, as their roles continue to be crucial in shaping the future of clubs. Wyscout simply makes their job better by offering videos of players for them to review before or after they view them live. With the expanding range of functionalities the company continues to add, clubs can now list their transfer-listed players, examine footage of player trials, contact agents to discuss potential offers, view contract duration of players they are interested in signing and much more.

By 2016, SkySports reported that Wyscout had hire a team of 200 analyst collecting data for 1,300 matches a week and the platform had achieved a total of 32,000 professional users. With such a rapidly growing usage and user base, the demands for the data also continue to grow. Clubs asked Wyscout to go deeper into specific areas, to not only track major leagues worldwide but collect statistics in lower divisions too to sport future talent. Today, the company offers data for even semi-professional level players. The growing amount of data collected by Wyscout also increasingly requires smarter analytics to be applied to it. For example, to help digest and compare the wide variety of data offered, Wyscout develops indexing models to allow clubs to compare two team across completely different leagues using similar ratios.

Today, Wyscout is the main platform during transfer windows worldwide. The large majority of transfers in the world of football initiate and often get closed through Wyscout. But the use of the platform has also expanded to track player performance and even journalists are now using it to write articles about particular players. Even players are now making use of Wyscout to track their stats and those of their next opposition.

Matteo Camponodico's plans don't end here. He has an ambitious vision to continue the incredible growth of the platform and we are guaranteed to continue to hear a lot more about this great platform.

The International Society of Performance Analysis in Sport

What is ISPAS?

The ISPAS was founded with the objective of improving global cooperation in the field of performance analysis. It was created as a platform for experts and practitioners to exchange their ideas, set global standards and collaborate in common research areas. It provides a shared forum to distribute scientific knowledge and disseminate information across the different types of individuals and groups in performance analysis, from academic researchers to club-level practitioners.

ISPAS’s current executive committee is consisted by five members: Prof. Nic James, Prof. Derek Peters, Prof. Mike Hughes, Dr. Hyongjun Choi and Dr. Nimai Parmar, with the former three teaching in the field of Sport, Health and Exercise Science at different British universities. As of June 2018, the society has accredited a total of 243 members and continues to grow its member base every month. Aside from joining a community of performance analysts for networking purposes, once accredited there are also various discounts and offers when purchasing analysis software available to accredited members, as well as discounted registration fees for ISPAS workshops and conferences. Accreditation comes in 5 different levels, with 1 and 2 being generic and 3 to 5 specialized in two verticals: a Scientific Route and a Applied Route. Once you submit an application for accreditation with supporting evidence, the panel will make a decision whether the level of accreditation applied to based on experiences and knowledge is approved.

Source: ISPAS.org

Source: ISPAS.org

The society also organizes yearly World Congresses with rotating locations around the world. In September 2018 the World Congress takes place in Zagreb, Croatia with a number of Professors from various countries in Europa and Asia taking part as keynote speakers, as well as practitioners in sports such as Rugby Union. These congresses tend to cover a wide range of topics around the area of sports performance, from analysis of technique and tactical evaluation to biomechanics, work rate and physical demands. 

Learn more about ISPAS in their official website here.

The role of a Performance Analyst in Sports

What is the role of a Performance Analyst in Sport?

Performance analysis is the process of assessing performance in a sport to develop an understanding of actions that can inform decision-making, optimize performance and support coaches and players in their journey towards optimal results. In many team sports this would consist on tactical assessment, movement analysis, video and statistical databasing and modeling and coach and player data presentations.

A few years ago, the role of a Performance Analyst simply consisted on recording a training session or game and creating video highlights to provide to managers and players for review. Video recording and editing constituted the large majority of an analyst’s role. Today, the role of Performance Analysts has evolved where analysts now require a lot more expertise in numerous tracking hardware and software that the advances in technology have brought to the industry, allowing for more sophisticated data collection, storage and increased coaching demands for data presentation. With the growing phenomenon of ‘big data’, the large amounts of data collected in the world of sport requires analytical experts to handle, disseminate and generate insights from this data.

Performance Analysts are like any other member in the backroom staff of a sporting team. On game day, analysts require to capture all the actions happening on the pitch to later tag and create video playlists of each player for the following day. They would then have one on one sessions with players led by the management team to present and discuss clips showing mistakes and any positives from the match. Team sessions are also held to show the team video analysis of the game as a group, discussing offensive and defensive formations, tactical analysis and any relevant actions that need consideration by coaches. Players and coaches may also ask for one-off clips and analysis as they find appropriate to review specific areas relevant to them to focus their development and learning.

Through both notational and motion analysis an analyst is able to provide stats and recording to coaching staff about areas such as position of the ball, player movement and involvement, fatigue, work rate, time of a particular action and the outcome of such action. In recent years, tools such as Sportcode, Dartfish or Coach Paint, as well as third-party data and statistics companies such as Opta, allow analysts to retrieve, capture, code and analyse the necessary data point in the most effective way for their reports. These tools and the vast data now available through different sources have allowed analysts to better observe their team’s performance and identify strengths and weaknesses, analyse opposition performance to counteract strengths and exploit weaknesses as well as evaluate effectiveness of training programs in improving match performance.

Within the context of football, most Performance Analyst roles will consist on responsibilities such as:

  • Record matches and training sessions

  • Pre-match team and opposition analysis production

  • Live match-day coding and editing of match footage post-game to produce post match reports

  • Update statistical and video databases for trend analysis

  • Update training databases and logs post each sessionProduce content for classroom sessions (usually for Academy) and team de-briefs

  • Ensure the upkeep of all filming and video capture equipment

  • Analytical ad hoc duties as requested by the team’s Management

  • Delivery of feedback to staff and players

  • Creation of reports on various aspect of performance

  • Interpretation, analysis and dissemination of performance data

As modern-day performance analysis departments grow within clubs and sporting organizations, analyst roles are becoming more and more specialized in a subset of the functions a traditional analyst would have undertaken in the past. Roles such as scouting analyst, tactical analyst, research analyst, technical scout, training analyst or even goalkeeper analyst are emerging positions in the world of performance analysis within a modern sporting organization and while the reflect the importance of such roles in competitive sporting teams, they are also fading the previously clearer definition of the role of a performance analyst and its duties.

Why is a Performance Analysis function important for a team or sporting organisation?

Research has shown that coaches and players, like any other humans, recall fewer than half the important actions and movements that happen on the pitch. Emotions may run high and the more extremely positive or negative events may overshadow other tactically relevant insights that occurred during the game. Collecting match information through video recording helps remove those biases and provide a more objective view of what happened on a game. Performance Analysts collect data from all the events happening on the pitch and create relevant metrics, either through coaches’ requests or by their own assessment, to show players and coaches on what went well and what went wrong.

The basis of coaching consists on assessing athlete performance, identifying areas of improvement, feeding back information to athletes, managing practices to convert the weaknesses into strengths and reassessing performance after a certain period of time or number of practices. With a Performance Analyst by their side, a coach can obtain the right level of information and performance insights in the early stages of the cycle to help them manage team and player development a lot more effectively. The work of a Performance Analyst can surface much sooner improvement areas and strengths of a player and team to allow coaches provide feedback to the team with a deeper level of understanding of how each individual in their team is performing. A good partnership between coaching staff, players and analysts can develop a player to their full potential and make a coach become a better coach through structured training sessions and more informed decision-making.

As technology and analytics advances in today’s society, so it does in the sporting industry. Data availability is growing rapidly with company’s like Opta offering third-party data and statistics on every game and player in major professional sports, allowing more and more teams to obtain access to their opponents recent performances, tactical decision, player profiles and more data points to enable them to generate a competitive advantage over opposition teams. In this new era of data, coaches and teams need analyst to help them navigate through all the information, manage and maintain the team’s databases and use performance analysis software to code the games, edit footages from the camera, extract data from providers like Opta and more technical skills that they would have imagined in the past. Failing to do so could mean that your team’s next rival might know more about your strengths and weaknesses that you might do about theirs. Your club could also fall behind in the advancements of performance optimization other clubs in the same competition are following to succeed.

The outcome of a good performance analysis means a well-defined coaching plan to improve a team’s or individual athlete’s performance. A coach can interpret a report or piece of analysis from its Performance Analyst to make adjustments to the team’s practices and tactical structure depending on the findings discovered. These pieces of analysis are intended to act as a valuable asset to coaches or players to make any decision for the following match, and have now become a strict requirement for any elite sporting organisation.

What skills are required to be a successful performance analyst?

The nature of a Performance Analyst in comparison to any other analyst role in a different industry is the sport element. Sports operate within extremes by default, and this is reflected in the day-to-day life of an analyst. The highs are higher and the lows are lower than many other  analytical positions. Long hours, short turnarounds, last minute requests and high standards and expectations are the norm in a field were everyone in a team, from players to any member of staff, is expected to give 110%.

Having said that, there are certain traits and hard skills a Performance Analyst is required to have to succeed in the field:

Knowledge of the sport. A key difference between a statistician and an analyst is the use of contextual information in order to generate insights. As a Performance Analyst you need to understand what’s important and what’s not in the sport you are analyzing, not only for the team to be successful but also for the particular coaching style of the team management. What is the coach aiming to get out his players? Tactical awareness, players, other coaches, club philosophies and history can help the Performance Analyst successfully contribute to the team’s success.

Building relationships with coaches. An analyst is part of the backroom staff of a team. This means that, like with any team, having a good relationship with coaches and players is crucial to gaining their trust and receiving credit for the work done, or even being heard. It may take up to 4 years for an analyst to appropriately settle in an elite professional team. An analyst needs to perfectly understand what the coaches want at every time and be able to accurately give them insights and information in a timely manner. Most of today’s analyst work consist on supplying whatever information the coaching staff is requesting for.

Effectively reacting to feedback. In line with building relationships with coaches is the ability to adapt the work produced to the needs, or even tastes, of the coaching staff and players. An analyst might spend hours immerse in in-depth data analysis and may produce very detailed pieces of analysis. However, coaches and other staff need insights in an understandable and useable way that is easy for them to apply during planning and decision-making.

Data consciousness. With numerous sources of data available, whether is from a third-party or collected internally, an analyst needs to be able to identify which data points are useful and which ones are redundant for every piece of analysis or report being produce. They also need to be able to assess the accuracy and reliability of such data by having an advanced level of knowledge of how the data used has been collected, stored or retrieved. Mishandling data sets may lead to inaccurate reports being produce that can mislead coaches and players.

Presenting your analysis reports. Depending on the club’s philosophy or coaches’ trust, analysts are required to provide a walkthrough explanation of their findings to coaches, players or team manager. Being able to clearly articulate the finding to a coach can give an opportunity for analysts to generate trust and establish themselves within the coaching team. Being a good communicator is essential for an analyst to demonstrate their work to players and coaches.

Analytical hard skills. Needless to say an analyst needs to be equip with enough technical knowledge on various analytics software and programming language, from basics like Excel to more advanced SQL, R or Python coding. Maths, IT and research and analytical skills to produce and understand complex data is essential Data visualization is also a key part in the role therefore proficiency in tools like Tableau are crucial to present findings in a easy-to-understand manner.

Videoanalysis editing software: Coach Paint and KlipDraw

Video editing software plays a key part during review sessions with players and coaches after a match or training session where tactical analysis is discussed in an engaging visual manner. Tools like Coach Paint, or the emerging KlipDraw, are great assets for Performance Analyst when grabbing player and coaches' attentions by visualizing formations, movements on the pitch, tactics and any in-game action that requires analysis.

Some of the key features these software offer are: player cut-out, spotlight, zoom, player tracking, zone tracking, distance measurement, trajectory marking and formation tools. They allow you to import your recorded videos, select the type of graphics and features to apply on them, trim the clips to ensure only highlights and relevant actions are included and export the final video as a standalone video file.

Between Coach Paint and KlipDraw the biggest difference is the license pricing. Coach Paint is a lot more expensive than KlipDraw, with the 'Fundamentals' subscription priced at $100 a month per user. KlipDraw on the other hand only costs $49 for a 6 months subscription, making it a lot more affordable. It is important to note that KlipDraw can only run on a Windows computer.

Both software offer trial periods before purchasing the complete license. It is recommended to try both of them before committing to one to see which one works for your needs.

What are Expected Goals (xG)?

What are Expected Goals (xG)?

Expected Goals, or xG, are the number of goals a player or team should have scored when considering the number and type of chances they had in a match. It is a way of using statistics to provide an objective view to common commentaries such as: ”He shouldn't miss that!” "He's got to score those chances!" "He should have had a hat-trick!”

Goals in football are rare events, with just over 2.5 goals scored on average per game. Therefore, the historical number of goals does not provide a large enough sample to predict the outcome of a match. This means that shots on target and total number of shots are now being used as the next closest stats to predict number of goals. However, not all shots have the same likelihood of ending up in the back of the net.

This is where xG comes into play. Expected Goals uses various characteristics of the shots being taken together with historical data of such types of shots to predict the likelihood of a specific shot being scored. Since xG is simply an averaged probability of a shot being scored, a team or player may outperform or underperform their xG value. This means that they could be scoring chances that the average player would miss or that they could be missing chances that are often scored.

xG is often used to analyse various scenarios:

  • To predict the score of an upcoming match using historical data of the teams involved.

  • Assess a team’s or player’s “true” performance on a match or season, regardless of their short-term form or one-off actions on a pitch. It provides a data point on the number and quality of chances being created regardless of the final result.

  • Identify performing players in underperforming teams, or those who receive less playing minutes, by assessing which ones are more effective than the quality of their chances they receive would suggest.

  • Understand the defensive performance of a team by assessing how effectively are they preventing the opponent team from scoring their chances.

Origin of the ExpectedGoals Model

In April 2012, Advanced Data Analyst Sam Green from sport statistics company Opta first explained his innovative approach to assessing the performance of Premier League goalscorers, inspired by similar models being used in American sports. However, it was not until the beginning of the 2017/18 season when BBC’s Match of The Day debut their use of xG by their popular football pundits to make xG a focal topic of conversation by many football fans. 

Over the years, Opta has collected numerous data points of in-game actions in all of the top football leagues. When creating the xG model, Sam Green and the Opta team analysed more than 300,000 shots and a number of different variables using Opta’s on-ball event data, such as angle of the shot, assist type, shot location, the in-game situation, the proximity of opposition defenders and distance from goal. They were then able to assign an xG value, usually as a percentage, to every goal attempt and determine how good a particular type of chance is. As new matches are played new data is collected to continuously refine the xG model.

There is no one specific model to calculate xG. When looking at xG it is important to consider that the xG value would depend on the factors that the analyst creating the xG model wants to incorporate in the calculations. Since its release to the public, the xG theory raised considerable attention in the analytics community, with many enthusiasts working and adjusting the model in their own ways in an attempt to perfect it. This means there are now several different xG models out there, each of them considering different factors. Some would consider whether it was a goal scored with their feet or with their head, other consider the situation that led to the shot and so on, but the final prediction each model outputs have shown to only vary slightly across different models.

How is xG calculated?

Opta’s xG model is based on the fact that the most basic requirement to score goals is to take shots. However, not all strikers score goals from the same number of shots. As Sam Green identified, in the 2011/12 season Van Persie only needed 5.4 shots to score a goal, while Luis Suarez took 13.8 shots for each goal he scored. However, they both shot the same number of times per game they played.

Cross

This is why Opta decided to look deeper into the quality of chances each striker received by adding the average location from which each shots was taken. However, they soon realized that location on its own was not enough. A penalty spot chance could come from a penalty kick, a header from a corner or a 1 on 1 against the goalkeeper, each with a very different likelihood of ending up in a goal. That is why Opta decided to incorporate additional data points to the model. Unfortunately, the exact model with all the factors considered by Opta has not been made public but a number of analyst have attempted to replicate or improve the model since its first release.

The xG model was designed to return an xG value for each player, team or chance depending on the dimension that the data is being analysed in: a full season, a particular match, a specific half in a game or group of goal attempts. Let’s say a player like Harry Kane takes 100 shots from chances that, based on historical Premier League data, have a probability of being scored of 0.202 (or 20.2%). Kane's xG value would be 20 expected goals scored (100 shots x 0.202). This xG number would contain an average of some ‘big scoring chances’ Kane took, such as penalties with 0.783xG, other non-penalty shots inside the box with varying xG values such as 0.387xG and maybe even shots outside the box with an 0.036xG value. The models attempts to balance the number of shots a player takes with the quality of these chances. For example, a player may get himself into very dangerous attacking positions inside the box in 23 occasions with high xG value and score the same number of goals than a player that continuously tries his luck from outside the box with 81 shots attempts that have a lower xG value.

Once an xG value has been calculated, a player or team’s performance can be evaluated on whether they are over or under-performing such value. In the above example, Harry Kane may actually score 25 goals during the full season, 5 goals above his 20 xG value, suggesting that his ability of converting chances is above-average and he can find the net in difficult scoring situations. Similarly, a player with a 20 xG value who has scored 15 goals suggests that he is missing chances that he probably should have scored.

Goalkeeper

Opta took xG a step further and assessed the impact the player had to a specific chance using their shot quality. They did so by factoring into the xG calculation the propensity to hit the target a shot taken by the player has and then comparing the former xG(Overall) value against this new xG(On Target) one. Their analysis showed that at the time Van der Vaart’s shooting saw his xG increase from 6.9xG to 10.3xG(On Target), suggesting that the type of shots he took were of higher quality than the average when xG was calculated before he took the shot. xG(OT) when compared to actual goals may also indicate how much a player was affected by the quality of goalkeeping he had to face. In the same season, Mikel Arteta scored 7 goals with just 3.5xG(OT) suggesting he got ‘luckier’ in front of goal as his shooting quality should have only given him just over 3 goals.

xG(OT) can be used to assess goalkeeping quality when used in reverse. Since it only takes into consideration shots on target, a keeper’s participation in these sort of chances is crucial to the final outcome of the play. De Gea conceding 22 goals with an 27xG(OT) suggests that he has blocked goals in situation were they are normally conceded.

Why are Expected Goals important in today's football?

Luck and randomness influences results in football more often than any other sports. We have all seem teams being dominated throughout a match and manage to score a last minute winning goal while having a lower number of chances than their opposition. But how sustainable is that? We have also seen world class strikers become out-of-form and spend a few games without seeing the back of the net. Is the player not taking advantage of the chances being provided by his teammates? xG allows us to assess the process over the results of a match, or performance of a player or team, by rating the quality of chances instead of the actual outcome.

football-1274661_1280.jpg

The most used example to explain xG’s efficiency is the Juventus season of 2015/16. Juventus only won 3 out of their first 10 games but the difference between their actual goals and xG was considerably high. This meant that the had the chances but were not converting them, suggesting that their negative run of results might not last if they just get a bit luckier in front of goal. Sacking manager Massimo Allegri could have been a mistake, since after match day 12 their luck changed and ended up winning the league title with 9 games spare.

xG gives us a more accurate way of predicting match outcomes than by simply using individual stats. In the Premier League, only 71.6% of teams that had the most shots won the fixture, while close to 81% of teams that obtain a higher xG score win games. It eliminates historical assumptions that popular tradition in football has created and provides a statistically relevant point of argument to whether the performance of a player or team is above or below the average given a number of historical data points.

garry-mendes-rodrigues-2846045_1280.jpg

When using expected goals to see which players are hitting the target more or less than the numbers suggest they should, teams can scout promising prolific goalscorers if they consistently score more goals than the quality of chances they get. On the other hand if a player surpasses his expected goals for a few games but has no history of doing so in the past, it might come down to his form and luck rather than goalscoring talent, and he might struggle to sustain that over a long period of time.

Limitations of the Expected Goals model

The xG model is only as good as the factors being input into its calculations. These data inputs are limited by the data we possess today from companies such as Opta. Other factors, such as shot power, curl or dip on the shot or whether the goalkeeper is unsighted or off balance might not be considered in most xG models out there. Due to model being based on averages, the random nature of a football match and the rarity of goals in the sport makes it almost impossible to consider with enough statistical significance all historical factors that can cause a goal to be scored. xG should be used as indicative and supportive information for decision making purposes and generating opinions rather than a finite answer to the performance of a team or player.

As the model’s creator Sam Green puts it: “a system like this will also fail to predict a high scoring game. Since it is based on averages and with around half of matches featuring fewer than 2.5 goals, this is to be expected”. We also need to consider that a shot taken by a Manchester United striker should have a higher xG than one taken by a Stoke City player, suggesting that on average Man Utd would outperform their xG on a chance by chance basis while Stoke City would underperform it if the xG is calculated using averages from all English teams' shot history.

Criticism and the Future of xG models

The recent misuse of Expected Goals as a analysis metric during pundit commentary has encouraged numerous criticism. A team may score one or two difficult chances early in a game and sit back for the remaining of the 90 minutes, allowing their opponents to take many shots from different positions, thus increasing the opponents xG. One could then claim that the losing team achieved a higher xG therefore deserves the win. This is why xG should always be taken with additional context of the game before creating a verdict. Statistics can just tell us what happened in a game but a wider view is necessary to show you how it happened and give you a clearer idea on what’s yet to come. Certain in-game actions by players cannot be measured with a statistical model today, such as the ability of a defender in getting in front of a shot attempt despite never touching the ball.

There is also a strong resistance from the football community to the use of data. Football is a traditional and emotional sport by nature, with experience and accepted wisdom dominating people’s opinions. Most fans see the use of statistics as intrusive and challenging their popular and historic knowledge of “the beautiful game”. After experiencing their team lose, most of them are not interested in listening to television pundits discuss how their team performed against their expected goals. Despite analytics having plenty to offer to football performance analysis, there are still doubters. xG’s debut in Match of the Day shaked social media with instant mentions of “stat nerds” and claims that the numbers in football are “pointless” and “bollocks”. However, it has been made clear by Opta that xG is not intended to ever replace scouts and pundits but simply aid them in their analysis of a game.

Despite all this resistance and criticism by some pundits and football fans to accept this new era of football analysis, Opta and various sport analysts continue to evolve the use of statistics to analyse performance in numerous areas in football. Models such as xG are the first round of statistical systems and will soon be followed by upcoming ones such as Defensive Coverage, which will assess tackles, blocks, interceptions, man-marking and clearances. Football’s data revolution has started and will continue to see developments every season.